Hello, I’m a senior engineer at Eptahub. In my line of work, a material’s datasheet is everything. But among all the numbers—density, thermal conductivity, hardness—one piece of data stands above all others in predicting how a part will behave under load: the stress-strain curve.
To a designer or a procurement manager, this simple-looking graph is a crystal ball. It tells us:
- How stiff is this material?
- At what point will it permanently deform?
- What is its absolute maximum strength?
- Will it stretch and give a warning before breaking, or will it fail suddenly and catastrophically?
Misunderstanding this curve is a direct path to component failure. Specifying material properties based on the wrong part of this curve is one of the most common design mistakes I see. This guide is my attempt to demystify it, moving it from the realm of theory into a practical tool you can use every day.
We’ll walk through how the curve is generated, what each section means for your design, and how to use this knowledge to specify materials with confidence.
Before we can read the curve, we have to understand its axes. The graph plots ความเครียด (on the y-axis) against ความเครียด (on the x-axis).
What is Stress (σ)?
In engineering terms, stress is the internal force that particles of a material exert on each other, spread over a given area. When you pull on a cable, you apply an external force. Stress is the internal resistance of the cable’s material to being pulled apart.
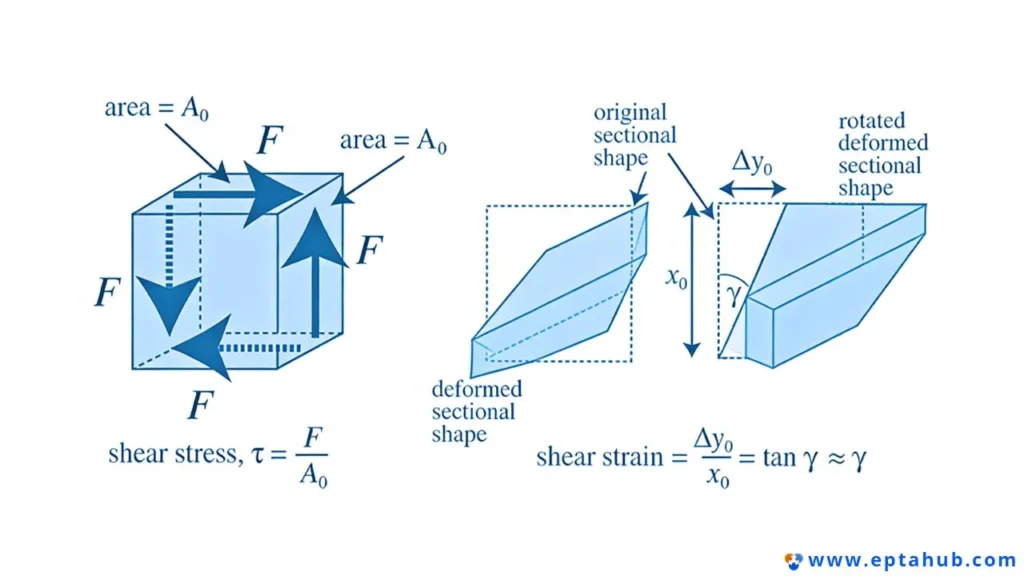
We calculate it with a simple formula:
Stress (σ) = Force (F) / Cross-Sectional Area (A₀)
- Force (F): The load applied to the part.
- Area (A₀): The original, undeformed cross-sectional area of the part.
- หน่วย: In the SI system, stress is measured in Pascals (Pa) or, more commonly, เมกะปาสคาล (MPa), which is Newtons per square millimeter (N/mm²). In the imperial system, it’s pounds per square inch (psi) or kilopounds per square inch (ksi).
What is Strain (ε)?
Strain is the measure of deformation. It’s not how much a part has stretched in absolute terms, but how much it has stretched relative to its original size. A 1 mm stretch is insignificant on a 10-meter beam but catastrophic on a 2 mm component. Strain normalizes this.
The formula for engineering strain is:
ความเครียด (ε) = การเปลี่ยนแปลงความยาว (ΔL) / ความยาวเดิม (L₀)
- Change in Length (ΔL): The amount the part has stretched or compressed.
- Original Length (L₀): The part’s length before any load was applied.
- หน่วย: Since strain is a ratio of length over length (e.g., mm/mm), it is technically ไม่มีมิติ. It’s often expressed as a decimal, a percentage (e.g., 5% strain), or in microstrain (μm/m).
Anatomy of the Curve: A Walkthrough from Zero Load to Fracture
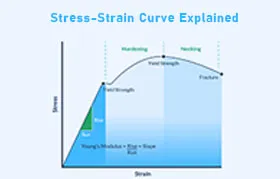
The stress-strain curve is the story of a material sample being pulled apart in a highly controlled tensile test. As the machine pulls (increasing strain), it measures the material’s resistance (the stress). Let’s walk through the key landmarks on this journey.
(Note: An illustrative image would be placed here in a real blog post)
The Elastic Region and Proportional Limit
From the origin to the first key point (the Proportional Limit), the curve is a straight line. This is the บริเวณยืดหยุ่น.
- What it means: In this region, the material behaves like a perfect spring. If you apply a load and then remove it, the material will return to its exact original shape. The deformation is temporary and non-permanent.
- กฎของฮุค: The linear relationship is described by Hooke’s Law: Stress is directly proportional to Strain (σ = Eε).
- The Modulus of Elasticity (Young’s Modulus, E): The slope of this straight line is the โมดูลัสของความยืดหยุ่น. It is a fundamental measure of a material’s ความแข็ง. A material with a high modulus (like steel) will be very stiff and deform very little under load. A material with a low modulus (like rubber) is flexible and will deform significantly.
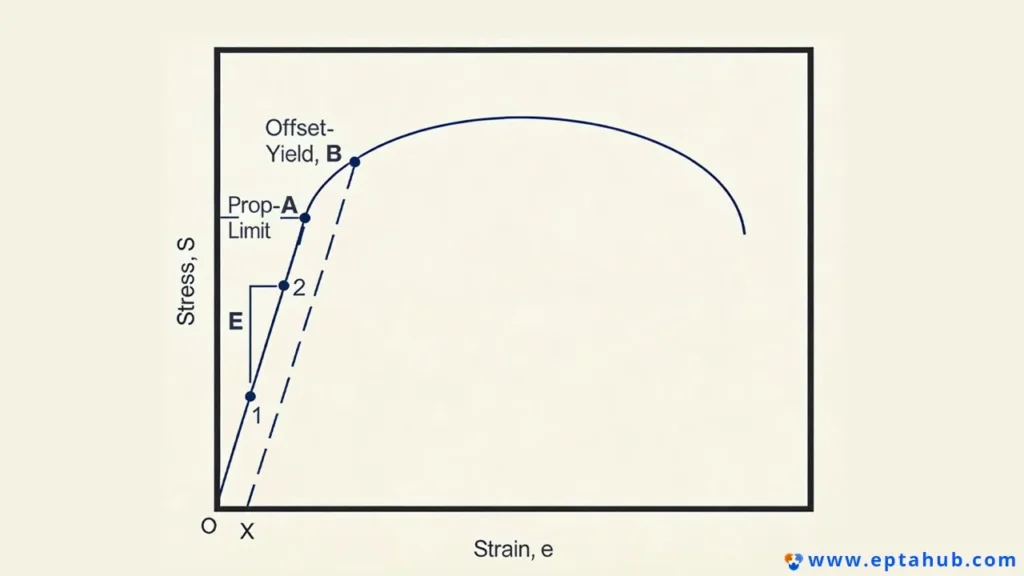
The Yield Point: The Point of No Return
This is arguably the most critical point on the curve for any structural designer. The ความแข็งแรงคราก (σy) is the stress at which the material transitions from elastic to plastic behavior.
- What it means: Once the stress exceeds the yield strength, the material has undergone plastic deformation. It will no longer return to its original shape after the load is removed. It has been permanently stretched.
- ตัวอย่างในโลกแห่งความเป็นจริง: If you bend a paperclip slightly, it springs back (elastic). If you bend it sharply, it stays bent (plastic). You have exceeded its yield strength.
- 0.2% Offset Yield Strength: Many modern materials, like aluminum alloys, don’t have a distinct, sharp yield point. Instead, the curve just gently bends. For these materials, we use the 0.2% offset method. We draw a line parallel to the initial elastic slope, starting at 0.002 (or 0.2%) strain on the x-axis. The point where this line intersects the curve is defined as the yield strength.
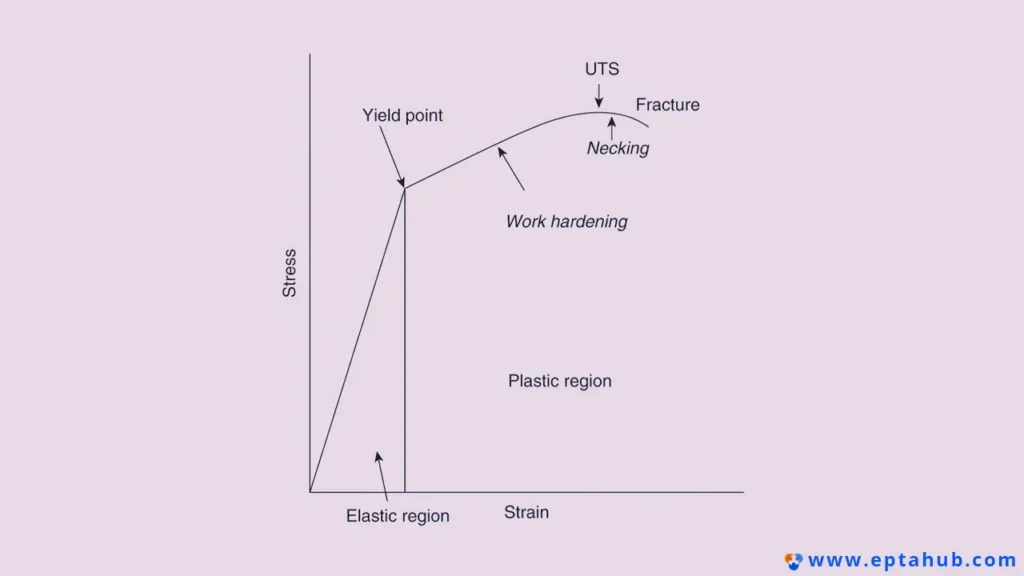
The Strain Hardening Region
After the material yields, something interesting happens. To continue stretching it, you need to apply an เพิ่มขึ้น amount of stress. The material actually becomes stronger as it deforms. This phenomenon is called การแข็งตัวของความเครียด or work hardening. The internal crystal structure of the metal is being rearranged in a way that resists further deformation.
The Ultimate Tensile Strength (UTS)
As strain hardening continues, the stress reaches a maximum value. This peak is the ความแข็งแรงดึงสูงสุด (UTS).
- What it means: The UTS is the maximum stress the material can withstand before it starts to fail. It’s an important value, but it is a common and dangerous mistake to design a part to withstand loads near its UTS. Long before it reaches this point, it has already yielded and permanently deformed.
- Necking: After the UTS is reached, a localized instability begins to form in the material sample, where the cross-section starts to shrink. This is called “necking.” Because the area is now decreasing, the sample can no longer support the same load, and the measured engineering stress begins to drop.
กระดูกหัก
This is the end of the line. The stress continues to fall as necking progresses until the material finally breaks. This is the fracture point.
Table 1: Key Properties from the Stress-Strain Curve
| คุณสมบัติ | เครื่องหมาย | What It Tells You In Plain English | Why It’s Critical for Your Design |
|---|---|---|---|
| โมดูลัสของความยืดหยุ่น | E | “How stiff is it?” (Resistance to elastic deformation) | Determines how much a part will deflect or bend under normal service loads. |
| ความแข็งแรงของผลผลิต | σy | “At what point will it permanently bend?” (Onset of plastic deformation) | The most important limit for designing structural parts that must not deform in use. |
| ความแข็งแรงดึงสูงสุด | UTS | “What’s the absolute maximum stress it can take?” | Represents the peak load-bearing capacity; useful for safety factor calculations but NOT a design limit. |
| Elongation at Fracture | %EL | “How much can it stretch before it breaks?” (A measure of ductility) | Indicates whether a material is ductile (stretches a lot) or brittle (snaps with little warning). |
Ductile vs. Brittle Behavior: Reading the Story of Failure
The overall shape of the stress-strain curve tells a vivid story about how a material will fail. In engineering, we broadly categorize materials into two camps: ductile and brittle.
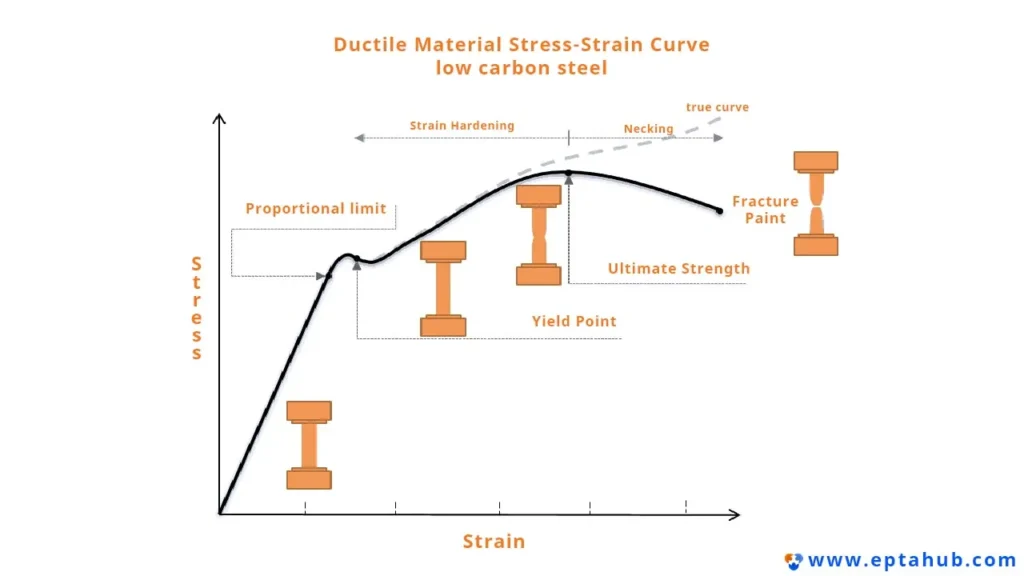
Ductile Materials
Think of materials like mild steel, aluminum, or copper. Their stress-strain curves feature a long, well-defined plastic region.
- The Curve’s Appearance: After the yield point, there is a significant amount of strain (stretching) before the fracture point is reached.
- What This Means: Ductile materials give a clear warning before they fail. They will visibly bend, stretch, and deform significantly before breaking. This is an incredibly desirable safety feature in applications like structural beams, car frames, and pressure vessels. This ability to absorb พลังงาน through plastic deformation is also known as toughness.
- Key Indicator: High percentage of elongation at fracture (>5%).
Brittle Materials
Now think of materials like cast iron, ceramics, or glass. Their curves tell a very different, and much shorter, story.

- The Curve’s Appearance: The plastic deformation region is very small or non-existent. The fracture point occurs very soon after the elastic limit.
- What This Means: Brittle materials fail suddenly and catastrophically with little or no warning. They don’t bend; they just snap. This behavior is acceptable for components under compressive loads (like concrete pillars) but is extremely dangerous in applications that experience tension or impact.
- Key Indicator: Low percentage of elongation at fracture (<5%).
Table 2: Ductile vs. Brittle Material Characteristics
| คุณสมบัติ | Ductile Material (e.g., Low-Carbon Steel) | Brittle Material (e.g., Cast Iron) |
|---|---|---|
| Plastic Deformation | Significant, large plastic region | Little to none |
| Failure Mode | Undergoes significant stretching and necking before failure. “Fails with warning.” | Fails suddenly with little prior deformation. “Fails without warning.” |
| Energy Absorption | High (Tough) | ต่ำ |
| Typical Examples | Most steels, aluminum alloys, copper, polymers | Cast iron, ceramics, glass, high-carbon tool steels |
Engineering vs. True Stress-Strain: A Note for Advanced Applications
The standard curve we’ve discussed is the เส้นโค้งความเค้น-ความเครียดทางวิศวกรรม. It’s simple and practical because it’s based on the ต้นฉบับ cross-sectional area (A₀) and ต้นฉบับ length (L₀) of the sample.
However, as you pull on the sample and it starts to neck down, its actual cross-sectional area is shrinking. If you were to calculate the stress based on the ทันที area at every moment, you would get the True Stress-Strain Curve.
- ความแตกต่างที่สำคัญ: On the engineering curve, the stress appears to drop after the UTS because the original area is used in the calculation, even though the real area is getting smaller. The true stress, which reflects the physics more accurately, continues to increase all the way to fracture.
- When does it matter? For 95% of structural design, where you are staying well below the yield point, the มาตรฐาน engineering curve is all you need. The true stress-strain curve is critical for advanced applications like FEA simulations of metal forming processes (e.g., deep drawing, forging), where understanding the material’s behavior during massive plastic deformation is essential for predicting failure.
Putting It All Together: From Theory to Purchase Order
Understanding the curve is one thing; using it to make smart decisions is another. Here’s how this knowledge applies directly to your job.
Design Philosophy: Yield Strength is Your Limit
For any component that must not permanently deform under its service load—a machine frame, a mounting bracket, a shaft, a fastener—the design process is simple:
- Calculate the maximum stress the component will experience in service.
- Choose a material whose ความแข็งแรงคราก (σy) is significantly higher than that maximum stress.
- The ratio between the yield strength and the working stress is your ปัจจัยด้านความปลอดภัย (FoS).
Factor of Safety (FoS) = Yield Strength / Working Stress
A common FoS for static loads is 1.5 to 3, depending on the application’s criticality. Never use the Ultimate Tensile Strength (UTS) as your design limit for such parts. A part loaded to its UTS is already massively and permanently deformed.
Case Study: The Stretched Lifting Hook
- สถานการณ์จำลอง: A company designs a custom lifting hook for their factory floor using a high-strength steel alloy.
- ความผิดพลาด: A junior engineer, looking at the material datasheet, sees a UTS of 800 MPa and a Yield Strength of 550 MPa. Believing “ultimate” means the usable limit, they design the hook so that at its maximum rated load of 10 tons, the stress in the most critical area is 750 MPa. This is below the UTS, so they believe it’s safe.
- ผลลัพธ์: The first time the hook is used to lift an 8-ton load, the stress reaches 600 MPa. This is well above the 550 MPa yield strength. The hook doesn’t break—the load is still below the UTS—but it permanently deforms. When the load is removed, the hook is visibly stretched and no longer has its original shape. It is now unsafe and must be scrapped.
- บทเรียน: The design limit should have been the yield strength, with a suitable factor of safety. If they had used a FoS of 2 against yield, the maximum allowable stress would have been 550 / 2 = 275 MPa. This would have kept the hook operating entirely within its elastic region, ensuring it returned to its original shape after every use.
The RFQ Checklist
When you send an RFQ to a supplier like เอปตาฮับ, clarity is key. Vague material specs lead to incorrect assumptions and potential part failure.
- Specify the Full Material Standard: Don’t just ask for “Aluminum 6061.” Ask for “Aluminum 6061-T6 per ASTM B221.” The standard (e.g., ASTM, ISO, EN) is a legally binding document that defines the required chemical composition และ the minimum mechanical properties, including yield strength and UTS.
- Call Out the Critical Property: If your application is all about stiffness, you might note: “Material must have a Modulus of Elasticity ≥ 70 GPa.” If it’s a structural part, you’d say: “Minimum Yield Strength of 276 MPa is a critical requirement.”
- Request Material Test Reports (MTRs): For critical components, this is non-negotiable. An MTR (also called a mill certificate or a “cert”) is a document from the material manufacturer that shows the results of the actual tensile test performed on the specific batch (or “heat”) of material your parts will be made from. It’s your proof that the material meets the standard you specified. It moves from “the datasheet says it should be…” to “the material in my hand เป็น…”.
คำถามที่พบบ่อย
Q: How do you calculate a stress-strain curve?
A: You don’t calculate it from a simple formula. A stress-strain curve is the experimental result obtained from a physical test. A standardized sample of the material is placed in a tensile testing machine (like a universal testing machine) and is pulled apart at a controlled rate. The machine records the applied force and the sample’s elongation, and this data is used to plot the curve.
Q: What is the formula for stress-strain?
A: There isn’t a single formula for the entire curve. However, for the initial, linear บริเวณยืดหยุ่น, the relationship is defined by Hooke’s Law: Stress (σ) = Modulus of Elasticity (E) × Strain (ε).
Q: What is the equation for calculating strain?
A: The formula for engineering strain is ความเครียด (ε) = การเปลี่ยนแปลงความยาว (ΔL) / ความยาวเดิม (L₀).
Q. What is toughness on the stress-strain curve?
A: Toughness is a measure of a material’s ability to absorb energy and plastically deform before fracturing. On the curve, it is represented by the total area under the curve, from the origin to the fracture point. A material with a high UTS and high ductility (like structural steel) will have a large area under its curve and is considered very tough.
Conclusion: Your Material’s Most Honest Resume
The stress-strain curve is more than just a line on a graph. It is the fundamental summary of a material’s mechanical identity. By learning to read it correctly, you can predict its stiffness, identify its true design limits, and anticipate its failure mode.
Use the yield strength as your guidepost for structural design. Demand clarity and documentation from your suppliers. When you do, you move from hoping a material is strong enough to knowing it is, and that is the foundation of all great engineering.
เอกสารอ้างอิง
1.ASTM E8 / E8M – 22, “วิธีการทดสอบมาตรฐานสำหรับการทดสอบแรงดึงของวัสดุโลหะ” ASTM International. https://www.astm.org/e0008_e0008m-22.html
2.Beer, F. P., Johnston, E. R., & DeWolf, J. T., Mechanics of Materials. A foundational textbook on the subject.